How to Read Motorsports Data: Sector Times, Tire Wear, and Pit Stop Strategies
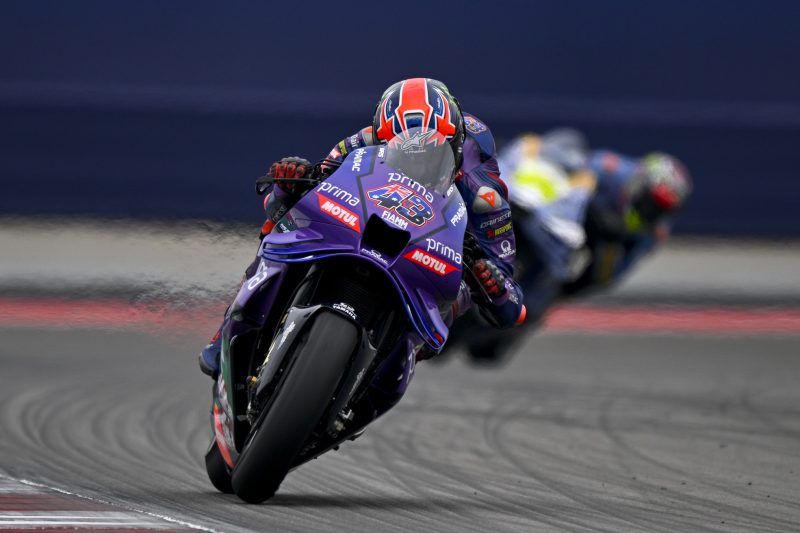
Modern motorsports are driven by data. Whether you’re betting on Formula 1, NASCAR, IndyCar, MotoGP, or endurance racing, understanding how to interpret performance metrics can dramatically improve your betting accuracy.
Sector times, tire degradation, pit windows, fuel strategy, and pace deltas all reveal how a race is unfolding — and which drivers or teams have an edge at any given moment.
This guide explains the most important motorsports data points, how to interpret them, and how bettors can use live telemetry and timing information to predict race outcomes with far more accuracy.
Section 1 — The Foundational Metrics
What Are Sector Times, and Why Are They Important?
Most racetracks are divided into three sectors. Each lap is broken down into:
- Sector 1 Often technical; tests braking and cornering.
- Sector 2: Usually, the rhythm section; consistent lines matter.
- Sector 3 typically includes straights and fast corners; it favors power and aero efficiency.
Sector times allow bettors to identify:
- Where a driver is fast
- Where weaknesses exist
- Whether improvements are sustainable
- How setups differ between teams
Snap improvements in a sector can indicate track evolution, tire warm-up, or setup changes.
How Do Lap Times Differ From Sector Times?
Lap times show the overall picture, but sector times reveal why pace changes occur.
A fast lap can result from:
- Strong top speed in Sector 3
- Perfect traction in Sector 1
- Tire warm-up advantages
Reading sector splits explain where speed is coming from.
What Pace Metrics Matter Most?
Key pace indicators include:
- Lap consistency
- Fastest laps
- Average lap deltas
- Long-run pace
- Tire-age-adjusted lap times
- Traffic-adjusted lap times
- Clean-air vs dirty-air performance
These metrics help forecast future race pace and overtaking potential.
Section 2 — Tire Wear & Degradation
What Is Tire Degradation in Motorsports?
Tire degradation refers to:
- Loss of grip
- Reduced cornering speed
- Increased braking distance
- Overheating
- Wear-induced sliding
Every racing series is affected by tire degradation, regardless of compound.
Which Metrics Indicate High Tire Wear?
Watch for:
- Increasing lap times. Gradual pace fade over several laps.
- Sharp drop-offs. Sudden 1–2 second losses signal a tire cliff.
- Rising sector times. Certain sectors degrade faster depending onthe layout.
- Driver radio complaints are often predictive of imminent degradation.
- Sliding in slow corners. The earliest visible sign of grip loss.
How Does Tire Strategy Influence Betting?
Tire strategy determines:
- Pit windows
- Overtaking potential
- Undercut and overcut opportunities
- Stint optimization
- Late-race pace
Aggressive strategies start fast but fade. Conservative strategies often surge late.
The betting edge comes from reading strategy shifts before the broadcast highlights them.
What Is the Tire “Cliff”?
The tire cliff is the point where grip collapses rapidly.
Lap times may suddenly fall by 1–3 seconds or more.
Identifying it early is crucial for live betting:
- Early cliff = forced early pit stop
- Late cliff = strong late-race surge
- Mismatched cliff timing = undercut or overcut opportunity
Each driver reaches the cliff at different laps based on driving style.
Section 3 — Pit Strategy & Undercuts/Overcuts
What Is an Undercut?
An undercut occurs when a trailing driver:
- Pits earlier
- Gets fresh tires
- Runs faster on out-laps
- Jumps ahead when the leader pits
Signs an undercut will succeed:
- Leader on worn tires
- Large pace delta between new vs old tires
- Clear air for the pitting car
- Falling sector times for the leader
Undercuts are most effective on high-degradation tracks.
What Is an Overcut?
An overcut happens when a driver stays out longer on older tires but gains an advantage through:
- Clear air
- Strong tire management
- Rival traffic after pitting
- Competitive lap times on worn rubber
Overcuts work best when degradation is low.
How Do Bettors Anticipate Pit Strategy Shifts?
Watch for:
- Pit crews preparing
- Tire blankets heating
- Radio messages
- Falling lap times
- Strategic bluffing
- Known pit window ranges
Once you know a car’s tendencies, pit strategy becomes predictable.
Why Do Safety Cars Change Everything?
Safety cars:
- Reduce speed
- Close gaps
- Create cheap pit stops
- Reset delta calculations
- Reshape race order
Immediately evaluate:
- Who pitted
- Who stayed out
- Track position changes
- Tire-age differences
Safety cars often decide races — but sharp bettors know who benefits most.
Section 4 — Car Performance Data
Clean Air vs Dirty Air Explained
- Clean Air: A car running without traffic, maximizing aero efficiency.
- Dirty Air Turbulent air reduces downforce and cornering grip.
Betting impact:
- Cars strong in clean air lead comfortably
- Cars weak in dirty air struggle to pass
- Some chassis handle turbulence better than others
Which Telemetry Signals Matter Most?
Key telemetry indicators:
- Throttle and brake traces
- Tire temperature
- Brake temperature
- Energy deployment (ERS/MGU systems)
- Fuel load
- Gear shifts
- GPS overlays
- Delta comparisons
Even without raw telemetry access, radio and commentary reveal issues.
What Does “Race Pace” Mean?
Race pace is the sustainable average lap time under race conditions.
It differs from the qualifying pace due to:
- Fuel load
- Tire conservation
- Traffic
- Overtaking requirements
Identifying true race pace early creates betting value.
Section 5 — Track Characteristics
How Track Layout Affects Performance
Track variables include:
- Corner count
- Straight length
- Elevation changes
- Braking zones
- Surface abrasiveness
- Passing opportunities
High-downforce tracks favor aero efficiency.
Power tracks favor top speed.
What Is Track Evolution?
Track evolution is grip improvement as rubber builds up.
Indicators include:
- Steadily dropping sector times
- Early lap inconsistency
- Mid-race pace jumps
- Reduced sliding
Cars struggling early may surge later as grip increases.
How Do Temperature Changes Affect Racing?
Temperature impacts:
- Tire wear
- Grip levels
- Engine mapping
- Brake cooling
- Aero efficiency
Hot conditions increase degradation.
Cool conditions improve tire life but slow warm-up.
Section 6 — Live Betting & Momentum Reading
Signals a Driver Is About to Be Overtaken
Watch for:
- Sector 3 fall-off
- Repeated lock-ups
- Falling top speed
- Tire overheating
- Energy deployment issues
- Missed apexes
Live odds often lag behind these signs.
Signals a Driver Is Gaining Momentum
Positive indicators:
- Improving sector splits
- Clean air ahead
- Tires entering the sweet spot
- Strong traction zones
- Rising top-speed deltas
- Efficient battery deployment
Momentum predicts overtakes before they happen.
Section 7 — Common Bettor Mistakes
Most Common Data Misreads
Avoid:
- Focusing only on fastest laps
- Ignoring long-run pace
- Misreading tire degradation
- Confusing qualifying pace with race pace
- Ignoring pit windows
- Underestimating traffic impact
- Overvaluing final practice times
Races are won through consistency and strategy — not one-lap speed.
Final Takeaway
Reading motorsports data effectively means going beyond basic lap times and understanding pace trends, tire behavior, pit strategy, and track evolution.
Sector splits expose hidden performance.
Pit strategies create overtaking windows.
Tire wear defines late-race outcomes.
Live data reveals momentum before sportsbooks adjust.
Bettors who master data interpretation consistently outperform the market.


