NBA Betting Blueprint: The One Stat You Need to Know About All 30 Teams

Summary
This guide argues for betting on NBA teams based on statistical profiles rather than reputation or star power. It provides key data points for each team to identify mispriced odds, focusing on against-the-spread performance, pace, efficiency, and specific weaknesses like poor rebounding or three-point defense.
For example, the Cavaliers are a good team but bad bet, failing to cover spreads, while the Pacers are now an under team despite their fast-paced reputation. The Clippers are overvalued by the market, and the Knicks remain undervalued. The conclusion is that the edge lies in exploiting the gap between public perception and what the actual numbers show.
Stop Betting Teams by Name. Start Betting Them by Profile.
If you’re still backing the Lakers because LeBron’s on the roster, fading the Spurs because “it’s a rebuild,” or auto-smashing Pacers overs because they were a track meet last year—you’re leaving money on the table.
This isn’t a power ranking. It’s a bettor’s field guide — 30 teams, 30 profiles, and the one stat you need to know for spotting when the odds are mispriced.
We’re breaking down the league by what actually matters for your bankroll:
- ATS performance vs. net rating – which “good” teams can’t cover, and which bad teams keep it close?
- Pace and totals tendencies – who’s inflating scoreboards, and who’s grinding games into the mud?
- Efficiency edges and leaks – where are the mismatches hiding in plain sight?
- Opponent props and team totals – which defenses are Swiss cheese, and which offenses can’t shoot straight?
Let’s get down to business so you can make sharper bets for the rest of the year.
Atlanta Hawks – Exposed on the Glass
The Stat:
The Hawks are getting out-rebounded by –3.6 per game and allowing 12.0 offensive boards per contest—bottom-10 in finishing defensive possessions cleanly.
Why It Matters:
Atlanta plays fast (top-10 pace) but can’t close possessions on the glass. That means extra scoring chances for opponents, which quietly inflates totals—especially against teams with active bigs. They’re also vulnerable to backdoor covers as favorites because they bleed second-chance points late in the game. Prop bettors should target opposing centers and forwards who crash the boards; the Hawks give up easy putback opportunities and bonus possessions.
Boston Celtics – Free Throws and Whistle Risk
The Stat:
Boston is getting outscored by -6.5 points per game at the free-throw line — the worst margin in the league. They rank dead last in offensive free-throw rate (0.160) and allow 26.3 opponent attempts per game.
Why It Matters:
The Celtics are elite offensively (4th in OffRtg) and launch threes at will, but they don’t draw fouls, and they send opponents to the stripe constantly. In tight games, that free-throw gap erodes their +7.0 net rating advantage—especially when laying points against physical teams that live at the line. The whistle disadvantage also matters for totals: Boston plays at a glacial pace (slowest in the league), but all those opponent free throws keep the clock stopped and can quietly push overs in grinding, physical matchups.
Brooklyn Nets – Weak Shooting Defense
The Stat:
Opponents are shooting 57.2% eFG against Brooklyn (bottom-3 in the NBA), knocking down 38.8% from three and 56.5% on twos—elite efficiency on both levels.
Why It Matters:
Brooklyn plays slow (27th in pace) but still bleeds 117.2 PPG because teams get clean looks every trip down. Even average offenses turn into scoring machines against this defense, which makes opposing perimeter scorers and stretch bigs prime prop targets—especially high-volume shooters. The Nets’ own offense is abysmal (worst scoring in the league), so you’re not blindly smashing overs, but any competent three-point offense can post a crooked number.
Charlotte Hornets – Worst 3-Point Defense
The Stat:
Opponents are shooting 39.3% from three against Charlotte, draining 13.5 threes per game on high volume.
Why It Matters:
The Hornets defend without fouling — best in the league at limiting opponent free throws — and they rebound well, ranking 4th in defensive rebounding percentage. But none of it matters when they give up open threes like it’s a shootaround. Against three-heavy offenses or teams with multiple movement shooters, this is a green light for opponent 3-point props and perimeter scorer totals.
Chicago Bulls – Track Meet Pace with Terrible Defense
The Stat:
Chicago plays at the 2nd-fastest pace in the NBA (102.6 possessions per game) while ranking bottom third in both offensive and defensive efficiency.
Why It Matters:
The Bulls churn out possessions but don’t finish them efficiently and can’t stop anyone (122.6 Opp PPG, 27th). They also don’t force turnovers (28th in defensive TO rate), so opponents get clean looks almost every trip down. That means extra counting stats across the board—points, rebounds, assists—making Chicago games solid targets for overs in the right matchups and opposing scorer props. The caveat: their raw PPG (117.3, 15th) makes the offense look better than it is. In slower, grind-it-out games, they can bog down quickly because they rely on volume, not skill.
Cleveland Cavaliers – Overvalued Public Darling
The Stat:
Cleveland is 14–11 straight-up with a +3.1 net rating (11th), but just 8–17 against the spread—a brutal 32% cover rate despite winning more than they lose.
Why It Matters:
The Cavs look like a legit top-10 team on paper: Donovan Mitchell averaging 30.5 PPG, top-10 offense and defense, solid advanced metrics. But the market is pricing them like a mini-contender every night, and they’re consistently underperforming those inflated spreads. Classic case of a good real team, bad ATS team — they win, just not by enough to cover. Laying points with Cleveland is dangerous, especially as a medium-to-large favorite. They’re far more valuable as short dogs.
Dallas Mavericks – League’s Worst Offense
The Stat:
Dallas posts a 109.1 offensive rating—dead last in the NBA—despite playing at a top-10 pace.
Why It Matters:
They’re shooting 34.1% from three (26th), 75.6% from the line (26th), and generating just 24.8 assists per game (25th)—lots of difficult, self-created looks instead of clean team offense. Even with a top-7 defense, Dallas struggles to pull away as favorites because they simply can’t score efficiently enough.
Be very cautious with Mavs overs unless the opponent’s offense can carry the total. Against physical or elite defenses, Dallas is a strong candidate for team-total unders and ugly grind games.
Denver Nuggets – Elite Offensive Juggernaut
The Stat:
Denver leads the league with a 125.9 offensive rating, scoring 125.0 PPG while playing at a below-average pace (24th)—pure efficiency, not volume.
Why It Matters:
This is a shooting clinic: 51.3% from the field, 39.7% from three, 82.7% from the line, and just 13.5 turnovers per game. The Nuggets finish an absurd percentage of their possessions with quality shots, making them a nightmare to defend. Their 15–8 O/U record reflects what happens when the league’s best offense takes the floor—even in slower-paced games, they find ways to push totals. Denver team totals and overs in pace-up spots are sharp plays, especially against weak defenses that can’t slow their half-court execution.
Detroit Pistons – Foul-Heavy Games
The Stat:
Detroit allows 28.6 opponent free throw attempts per game—among the highest in the league—while attempting 28.9 themselves, creating a combined ~57.5 FTAs per game.
Why It Matters:
The Pistons have a top-3 defense by efficiency, but they hack constantly, sending opponents to the line and keeping teams alive via free throws. As favorites, they can dominate shot quality but still sweat out covers because opponents hang around at the stripe. This is also a prime environment for props—foul-drawing stars will feast on points and FTA totals against Detroit. In matchups against aggressive, rim-attacking teams, this can quietly push overs or at least inflate opponent team totals. Detroit games aren’t clean—they’re whistle-heavy, volatile, and often closer than they should be.
Golden State Warriors – Defense-First, Not The Old Warriors
The Stat:
Golden State has the 2nd-best defensive rating in the NBA (111.9), holding opponents to 111.7 PPG and just 33.6% from three (top-5).
Why It Matters:
The brand screams Curry shootouts, but this version is built on defense. Golden State is only 22nd in offensive rating despite launching the 2nd-most threes in the league, and they play at a middle-of-the-pack pace. Don’t auto-assume overs just because it’s the Warriors—their defense is doing the heavy lifting and keeps games in the low-to-mid scoring range. As slight favorites or small dogs, their defensive consistency gives them a better floor than their offensive reputation suggests. This isn’t your 2015 Warriors—it’s a lower-scoring, tighter version.
Houston Rockets – Elite Rebounding Edge
The Stat:
Houston leads the NBA with a +10.8 rebound margin per game, grabbing 48.8 boards (1st) while limiting opponents to just 38.0.
Why It Matters:
The Rockets are already elite on both ends (2nd in OffRtg, 5th in DefRtg), but the rebounding makes them a nightmare to fade. They grab 16.1 offensive boards per game (1st in the league), creating extra possessions for one of the most efficient offenses in basketball. On defense, they lock down the glass and deny opponents second chances. As favorites, they’re less prone to variance because they dominate both efficiency and volume—reflected in their 14–7 ATS record. For props, Houston bigs are live for rebounds and double-doubles, while opposing centers often see their rebounding ceilings capped.
Indiana Pacers – New Pacers Are an Under Team
The Stat:
Indiana is 9–15 to the under (62.5% unders rate), scoring just 111.3 PPG (29th) with the 27th-ranked offense in the league.
Why It Matters:
The market—and public memory—still associate the Pacers with wild, high-scoring track meets, but this version can’t shoot. They’re hitting 43.4% from the field (29th), and 33.2% from three (29th). Books often hang inflated totals because of roster names (Siakam, Mathurin) and last year’s style, but this year’s team is a brick factory.
In matchups against solid defenses or slower teams, unders and Indiana team-total unders deserve serious consideration. Despite being 6–18 straight-up, they’re 13–11 ATS, showing they can hang around big numbers—the better angle is often fading their scoring, not always their spread.
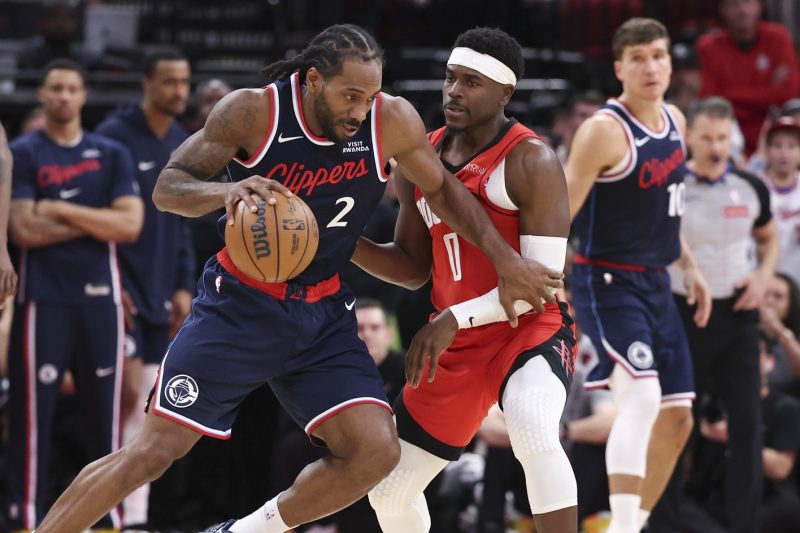
Los Angeles Clippers – Brand Name Team Still Being Overpriced
The Stat:
The Clippers are 7–17 against the spread (29% cover rate)—one of the worst in the NBA despite a roster loaded with star names.
Why It Matters:
Books are still hanging Clippers lines with the Harden + Kawhi tax baked in, assuming they’ll “figure it out,” but the reality is they’re a bottom-tier team that can’t even catch enough points as underdogs. Their offense is middling (21st in OffRtg), their defense is poor (25th), and they play at the slowest pace in the league (28th), meaning there’s no variance upside to bail them out.
Until the market fully adjusts, the Clippers are fade-first on sides, especially as favorites or short dogs. You can still target Harden and Kawhi props individually, but on spreads, that 29% cover rate is a massive red flag.
Los Angeles Lakers – Dominates the Free Throw Line
The Stat:
The Lakers are outscoring opponents by +5.3 made free throws per game (22.6 vs. 17.3), attempting 6.8 more FTs per night while leading the league in free-throw rate.
Why It Matters:
This Lakers team wins the whistle battle almost every night. Luka and Reaves attack relentlessly, Ayton lives around the rim, and they generate a built-in +5 points per game at the stripe while rarely sending opponents to the line.
As favorites, that free-throw edge helps them cover spreads in tight games—reflected in their 15–8 ATS record. With elite field goal shooting (50.7%, 2nd in the league) and below-average defense, this creates a very friendly environment for overs and Lakers team-total overs, matching their 16–7 O/U start. The whistle is their secret weapon.
Memphis Grizzlies – Inefficient Perimeter Offense
The Stat:
Memphis is shooting just 33.6% from three on 38.0 attempts per game—bottom-3 efficiency on high volume—contributing to an 8–16 under record despite playing at a top-10 pace.
Why It Matters:
The names (Ja, JJJ, young shooters) scream up-tempo fireworks, but the actual shot-making isn’t there. They launch a ton of threes, they just brick them. Their offense is 25th in efficiency despite Ja being back, and their top-10 defense keeps games lower-scoring than their pace suggests. The market often inflates totals based on pace and reputation, but this team’s ceiling is capped by their inability to convert.
Miami Heat – Maximum-Possession Team
The Stat:
Miami plays at the fastest pace in the NBA, averaging 92.7 FGA while allowing 95.9 opponent FGA—most in the league.
Why It Matters:
Miami games are a stat buffet. They average 121.7 points per game (3rd in the league), but rank just 14th in offensive rating — all gas, less efficiency. It’s volume over precision. Despite having a legitimately good defense (6th in DefRtg), opponents still average 118.2 PPG because of the sheer number of possessions. This creates a prime environment for counting-stat props (points, rebounds, assists) on both sides. Key nuance: don’t mistake their 121.7 PPG for unstoppable efficiency—pace is doing most of the heavy lifting. This is volume basketball at its finest.
Milwaukee Bucks – Live by the Jumper, Lose at the Line
The Stat:
Milwaukee is getting outscored by –6.3 points per game at the free throw line despite shooting 40.9% from three (best in the NBA) and posting a 58.1% eFG (2nd).
Why It Matters:
The Bucks look like a shooting cheat code on paper—elite from the field, best three-point percentage in the league—but they rarely get to the line (29th in FT rate), and when they do, they’re the worst free-throw shooting team in the NBA (71.4%).
Meanwhile, they foul constantly and send opponents to the stripe for easy points. In close spread ranges, that 6-point FT margin can be the difference between covering and losing by a possession. They’re dangerous to back as small favorites because great shooting can be undone by an ugly night at the line and a parade of opponent free throws.
Minnesota Timberwolves – Great NBA Team, Bad Betting Team
The Stat:
Minnesota is 15–9 straight up with a +4.8 net rating (7th in the league), but just 8–16 against the spread — a brutal 33% cover rate.
Why It Matters:
The Wolves are riding last year’s defensive rep, Ant’s rising star power, and strong current metrics — and the market’s pricing them like a 50-win contender. Problem is, they’re not beating those inflated numbers—they win, but rarely by enough to cash tickets.
Be very cautious about auto-laying points with Minnesota, especially as a medium or big favorite. They’re better targets in moneyline parlays or in spots where the market briefly sours on them, not as routine spread bets.
New Orleans Pelicans – Green Light Against Their Perimeter Defense
The Stat:
Opponents are draining 15.4 threes per game on 41.6 attempts against New Orleans—both league-worst marks.
Why It Matters:
This isn’t just a bad defense; it’s a dream matchup for shooters. Teams are taking 41+ threes per game and hitting them at a strong clip (37.1%), creating scoreboard inflation without needing a track meet. This makes them a prime target for overs, especially when facing teams with multiple high-volume shooters. It’s also a beautiful matchup for opponent three-point props and wing/guard scoring overs. If the opposing team can shoot, the Pelicans are a green light for offensive games.
New York Knicks – Elite Team the Market Still Hasn’t Fully Taxed
The Stat:
The Knicks are 16–8 against the spread (66.7% cover rate) with a +8.8 net rating (3rd in the NBA), dominating via efficiency and control in a slow-paced, methodical system.
Why It Matters:
New York has true contender metrics—top-3 offense, strong defense, top-3 net rating—but the market still hasn’t fully taxed them. Their 16–8 ATS record suggests the market is undervaluing just how clean and repeatable their style is. The Knicks are one of the few teams you can still trust as favorites; the underlying numbers match or exceed their record. In tight spreads (–3 to +3), they’re especially appealing thanks to elite late-game creators like Brunson and KAT — plus a possession edge that matters in crunch time.
Oklahoma City Thunder – Blowout Risk, Defensive Clamp Monster
The Stat:
OKC is outscoring opponents by +16.1 points per game (123.0 to 106.9)—best margin in the NBA by a mile—while posting the #1 defense in the league.
Why It Matters:
The Thunder aren’t just winning—they’re erasing teams. A “close” Thunder game is often still a double-digit win. They force 17.8 turnovers per game (league-worst for opponents) and suffocate efficiency on defense while running a top-5 offense with Shai at 32.8 PPG.
Be very careful backing underdog sides or opponent overs against them—normal projections often overrate what the other team can score. OKC’s 13–11 ATS record is barely above water — mostly because the spreads are already huge. The better value? Alt spreads in blowout spots, and unders on stars or opposing teams in tough matchups.
Orlando Magic – FT-Driven Offense, Real Defense
The Stat:
Orlando leads the league in free-throw volume — 29.2 attempts per game and a 0.33 free-throw rate — while ranking 4th in defensive rating (112.1). It’s a rare blend of whistle-heavy offense and top-tier defense.
Why It Matters:
The Magic can manufacture points at the line even when jumpers aren’t falling—they don’t bomb threes, but they’re elite at getting whistles and converting (80.0% FT%, 1st). Their defense is legit top-5 by efficiency, keeping opponent scoring in check despite a slightly above-average pace. That combo makes them a tough fade in close spreads and creates a relatively high, stable scoring floor for their team totals in competitive games.
Philadelphia 76ers – Maxey’s One-Man Offense
The Stat:
Tyrese Maxey is putting up 31 a night while playing nearly 40 minutes and doing just about everything offensively — scoring, shooting, getting to the line. And he’s carrying a roster that, by the numbers, grades out as a .500-level team.
Why It Matters:
This is alpha usage with elite efficiency—the entire offense runs through Maxey when he’s on the floor. His minutes (nearly 40 per game) and consistent volume make his points and threes props some of the most bankable in the league, regardless of the team’s mid-tier metrics. Books will keep inflating his lines, but as long as the role looks like this, you’re dealing with a high-volume, high-efficiency ceiling scorer.
Phoenix Suns – Slow Pace, Fast Covers
The Stat:
Phoenix is 15–8–1 ATS (65.2% cover rate) while playing at the 25th-ranked pace.
Why It Matters:
The Suns don’t play fast, but they manufacture extra possessions through elite turnover creation—10.8 steals per game and constant deflections lead to easy transition buckets and open threes. That allows them to punch above their modest +2.4 net rating in terms of covers.
Books tend to shade totals down because of pace, but the spread performance shows Phoenix is better than their record and advanced metrics suggest. They’re consistently outperforming market expectations, making them one of the sharper ATS plays in the league right now.
Portland Trail Blazers – Whistle-Fueled Track Meet
The Stat:
Portland games are 15–9 to the over, fueled by a 102.2 pace (3rd), 117.4 PPG scored, 120.6 PPG allowed.
Why It Matters:
This is a classic whistle-fueled track meet profile: fast pace, bad defense (21st in DefRtg), and massive free-throw volume for both sides. Portland attempts 28.5 FTA per game (3rd) while allowing 28.3 (29th), creating constant clock stoppages and extra scoring opportunities. The market already leans overs (15–9), but this is still one of the cleanest “automatic over” environments in the league when the matchup cooperates. Portland games don’t slow down, and neither do the scoreboards.
Sacramento Kings – Softest Defensive Environment in the League
The Stat:
Sacramento is getting outscored by 10.6 PPG with the 6th-fastest pace and a 119.9 defensive rating, allowing opponents to shoot 59.8% on twos and 56.9% overall.
Why It Matters:
This is one of the league’s softest defensive environments, especially inside the arc, and they still push tempo relentlessly. Opponents get layup lines and clean looks every trip down, making Sacramento a perfect recipe for opposing team totals overs and alt spreads against them. \
The Kings are fast, offensively anemic (28th in OffRtg), and defensively helpless—essentially a practice squad for opposing scorers. Fade Sacramento on sides, attack them on opponent props, and lean into overs when they face competent offenses.
San Antonio Spurs – Efficient Two-Point Scoring Machine
The Stat:
San Antonio owns a 119.0 offensive rating (7th) and scores 119.6 PPG on 57.1% shooting inside the arc (4th).
Why It Matters:
This is no longer a “cute rebuild”—the Spurs profile as a legit top-10 offense with a solidly positive net rating. They live in efficient two-point scoring and free throws (25.8 FTA, top-10 FTr), which tends to be more repeatable than streaky three-point shooting.
That makes them more trustworthy than their brand perception suggests in coin-flip spreads or short-dog spots, especially against teams with weak rim protection. Wemby’s dominance anchors both ends, and the Spurs’ 16–7 record isn’t a fluke—they’re for real.
Toronto Raptors – Win More Than They Cover
The Stat:
Toronto has a top-15 offense and defense (13th in OffRtg, 10th in DefRtg), but is just 11–15 against the spread (42.3%) despite a 15–11 record.
Why It Matters:
The Raptors win more than they cover—their efficiency says “slightly above average,” but the market is pricing them like a mini-contender after the roster upgrade (Ingram, Scottie, Quickley, RJ). Because the scoring load is spread across four guys averaging 16–21 PPG, you don’t get a single “must-bet” alpha prop, but you do get a team that’s often overvalued as a favorite.
They’re solid but not dominant, and spreads consistently ask for too much. Be cautious laying points with Toronto—they’re better targets in moneyline parlays or when the market briefly sours on them.
Utah Jazz – Fast Pace, Zero Defense
The Stat:
Utah’s giving up 125.8 points a night with the league’s 28th-ranked defense — and they’re doing it at the 5th-fastest pace. No surprise their games are 14–9 to the over.
Why It Matters:
You get high pace plus bottom-tier defense, which is almost always an overs recipe. Opponents shoot 58.2% on twos and 37.5% on threes against Utah, turning every game into a track meet with minimal resistance.
This is a prime team to target for game overs and opponent team total overs, especially against any competent offense or high-volume three-point team. The Jazz play fast, score adequately, and defend basically nothing—a perfect storm for inflated scoreboards.
Washington Wizards – Historically Bad, Still Overvalued
The Stat:
They play fast, defend no one, and get blown out nightly — 128.3 points allowed, –15.4 net rating, dead last in defense. And yet they’re still burning bettors at 6–16 ATS.
Why It Matters:
The Wizards aren’t just bad — they’re historically inefficient and still overpriced by the market. They play at the 4th-fastest pace while fielding the worst defense in the NBA, allowing opponents to shoot 46.5 FGM per game on 95.3 attempts.
High pace plus league-worst defense equals automatic overs, opponent alt spreads, and blowout scripts. The 6–16 ATS mark with a –15.4 net rating screams “auto-fade unless the line is outrageous.” Washington is a green light for opposing scorers, team totals, and alternate spreads—one of the safest fades in the league.
The Bottom Line: Bet Profiles, Not Perception
Thirty teams. Thirty angles. One universal truth: the market prices what people think, not what the numbers show.
The Clippers still get star tax despite a 29% cover rate. The Pacers get inflated totals based on last year’s pace. The Cavaliers win games but rarely by enough. The Pelicans are a three-point shooting gallery disguised as an NBA defense.
The edge isn’t in knowing who’s good—it’s in knowing who the market thinks is good, who actually delivers, and where the gap creates value. The season’s a quarter done. I did the deep stat dive for you — now it’s on you to use it and beat the market.